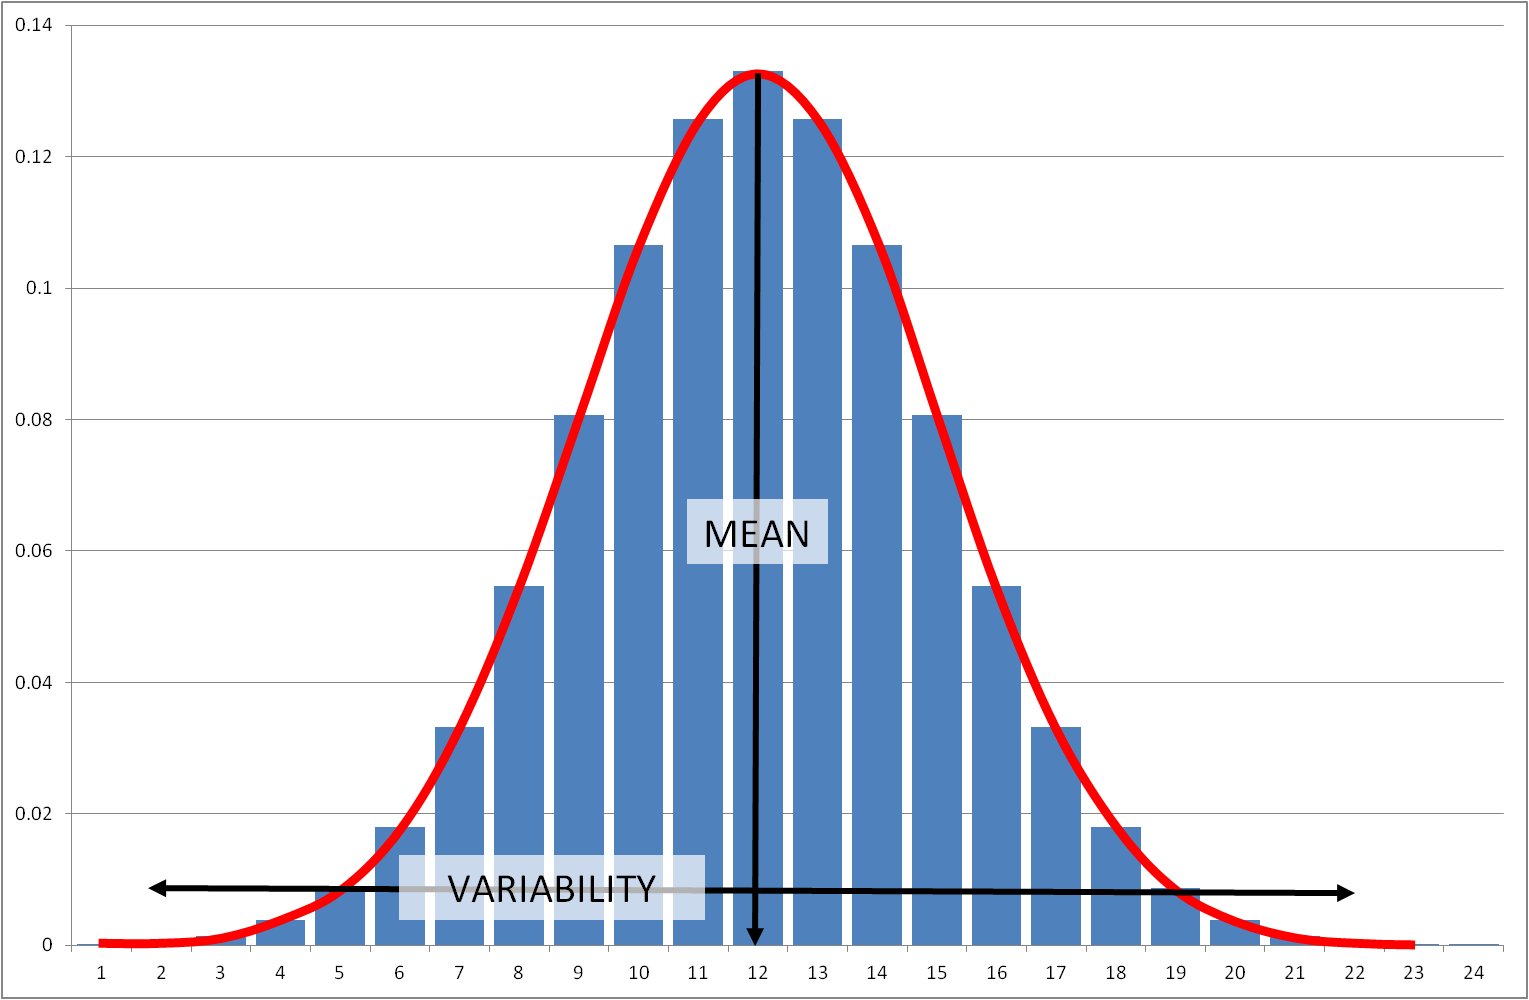
Another recognisable figure is that of the 'Normal Distribution' (commonly referred to as the 'Bell curve' due to its shape).

The standard shape is symmetrical about a 'Mean' (average) value with the width of the spread being determined by the 'Variability' of the property being represented.
Operating the model
Before starting this model use the sliders to set the Mean and the Standard Deviation (which is a measure of the variability). The model generates pseudo-random numbers from a population with the defined mean and standard deviation and the Normal profile develops. Note how the shape matures with the number of iterations (or random values generated). As the peak grows the model rescales.
You can reset the web page and examine the impact of different mean and standard deviation values by pressing 'F5'.
Discussion
A good example of this principle is the distribution of heights of individuals in a group or population. The most common height will be the mean of the group's heights but there is wide variability, with some people being very short or tall.
Another common example which gives a Normal Distribution is the manufacture of a precision-made screw, made to a high tolerance. The diameter of cross-section of the screw may be 1cm but with some variability ± 0.001cm as a result of factors in the production process and materials used. Accurately measuring a large number of objects you will find a range of widths but because of the need by customers for a standard product their diameters will be close to 1cm - a few slightly smaller or larger. The profile of distribution will have a tall central peak and narrow range of values (or spread).
Measures of height or diameter are 'continuous' variables because they could take any value and are not limited to fixed or 'discrete' widths (e.g. 0.9, 1.0 or 1.1 cm) but all the decimal values in between.
The term Mean has a specific mathematical meaning and is often confused with the broader term 'Average'. There are three statistical measures of 'Average':
In a Normal Distribution the Mean, Median and Mode will all have the same value. Furthermore, 50% of measured values will be less than, and 50% more than, the mean creating the symmetrical profile.
Variance and standard deviation
The Standard Deviation is a measure of how spread out numbers are. Generally, 68% of the data is within 1 standard deviation (unit) either side of the mean, 95% is within 2 standard deviations and 99.7% is within 3 standard deviations.
The Variance is defined as the (mean) average of the squared differences from the Mean.