Eurovision Voting Analysis
![]() Eurovision voting has always fascinated me - trying to fathom the politics of inter-country voting. Over the last two years an interesting change to the scoring was introduced
with both country televotes and national jury panels contributing to the results. Details of how the voting system works can be found here:
Eurovision Voting (be warned - the explanation is only for the bravest bureaucrat!).
Eurovision voting has always fascinated me - trying to fathom the politics of inter-country voting. Over the last two years an interesting change to the scoring was introduced
with both country televotes and national jury panels contributing to the results. Details of how the voting system works can be found here:
Eurovision Voting (be warned - the explanation is only for the bravest bureaucrat!).
Twenty five (25) countries performed but 42 countries were eligible to vote. After the results were declared on Saturday 13th May 2017, I wondered how closely each country's jury panel and population vote matched with the final competitor positions...and whether the panel votes (comprising only a few people) aligned with the televotes (involving thousands of calls and texts) of each country (i.e. were the juries representative of their respective countries - do their tastes align?).
I obtained the voting patterns from the Eurovision website. Scores ranged from 12 points for the country's favourite song, 10 points for second, and 8 points down to 1 for the next 8 preferences. This is equivalent to ranking the countries first to tenth (positions 1 to 10) but with bonus points for competitors placed first or second (see table below).
| Position/Rank | Points Score |
|---|---|
| 1st | 12 |
| 2nd | 10 |
| 3rd | 8 |
| 4th | 7 |
| 5th | 6 |
| 6th | 5 |
| 7th | 4 |
| 8th | 3 |
| 9th | 2 |
| 10th | 1 |
I performed this transformation from 'Score' to 'Rank' on each country's Jury and Televote results. This allowed me to make a direct comparison between a competitor's final position in the contest with the individual country votes. (Where I use the term 'country votes' I am referring to both the country's (i) Jury and (ii) population Televote).
To measure the agreement I calculated the difference between the final rankings of each competitor and the ranking given by each country vote. As an illustration of this, I've focused on the UK Jury and UK Televote results. The following tables give a variety of ways of measuring the difference. The columns marked:
[1] contain the differences (i.e. country ranking - competitor's final ranking) which gives both positive and negative results,
[2] represents the absolute difference (i.e. all negative values of difference and converted to positive values) and
[3] is the square of the differences. :
| Competitor Rank | UK Jury Rank | [1] Diff | [2] Abs(Diff) | [3] Diff2 |
|---|---|---|---|---|
| 1 | 1 | 0 | 0 | 0 |
| 2 | 4 | 2 | 2 | 4 |
| 3 | 5 | 2 | 2 | 4 |
| 4 | 6 | 2 | 2 | 4 |
| 5 | 3 | -2 | 2 | 4 |
| 6 | - | 0 | 0 | 0 |
| 7 | - | 0 | 0 | 0 |
| 8 | - | 0 | 0 | 0 |
| 9 | 2 | -7 | 7 | 49 |
| 10 | - | 0 | 0 | 0 |
| 11 | 7 | -4 | 4 | 16 |
| 12 | - | 0 | 0 | 0 |
| 13 | - | 0 | 0 | 0 |
| 14 | - | 0 | 0 | 0 |
| 15 | - | 0 | 0 | 0 |
| 16 | 8 | -8 | 8 | 64 |
| 17 | 10 | -7 | 7 | 49 |
| 18 | - | 0 | 0 | 0 |
| 19 | - | 0 | 0 | 0 |
| 20 | 9 | -11 | 11 | 121 |
| 21 | - | 0 | 0 | 0 |
| 22 | - | 0 | 0 | 0 |
| 23 | - | 0 | 0 | 0 |
| 24 | - | 0 | 0 | 0 |
| 25 | - | 0 | 0 | 0 |
| 26 | - | 0 | 0 | 0 |
| Total (Σ) | -33 | 45 | 315 |
| Competitor Rank | UK Televote Rank | [1] Diff | [2] Abs(Diff) | [3] Diff2 |
|---|---|---|---|---|
| 1 | 3 | 2 | 2 | 4 |
| 2 | 1 | -1 | 1 | 1 |
| 3 | 5 | 2 | 2 | 4 |
| 4 | 8 | 4 | 4 | 16 |
| 5 | 7 | 2 | 2 | 4 |
| 6 | 9 | 3 | 3 | 9 |
| 7 | 4 | -3 | 3 | 9 |
| 8 | 10 | 2 | 2 | 4 |
| 9 | - | 0 | 0 | 0 |
| 10 | - | 0 | 0 | 0 |
| 11 | - | 0 | 0 | 0 |
| 12 | - | 0 | 0 | 0 |
| 13 | 6 | -7 | 7 | 49 |
| 14 | - | 0 | 0 | 0 |
| 15 | - | 0 | 0 | 0 |
| 16 | - | 0 | 0 | 0 |
| 17 | - | 0 | 0 | 0 |
| 18 | - | 0 | 0 | 0 |
| 19 | - | 0 | 0 | 0 |
| 20 | - | 0 | 0 | 0 |
| 21 | - | 0 | 0 | 0 |
| 22 | 2 | -20 | 20 | 400 |
| 23 | - | 0 | 0 | 0 |
| 24 | - | 0 | 0 | 0 |
| 25 | - | 0 | 0 | 0 |
| 26 | - | 0 | 0 | 0 |
| Total (Σ) | -16 | 46 | 500 |
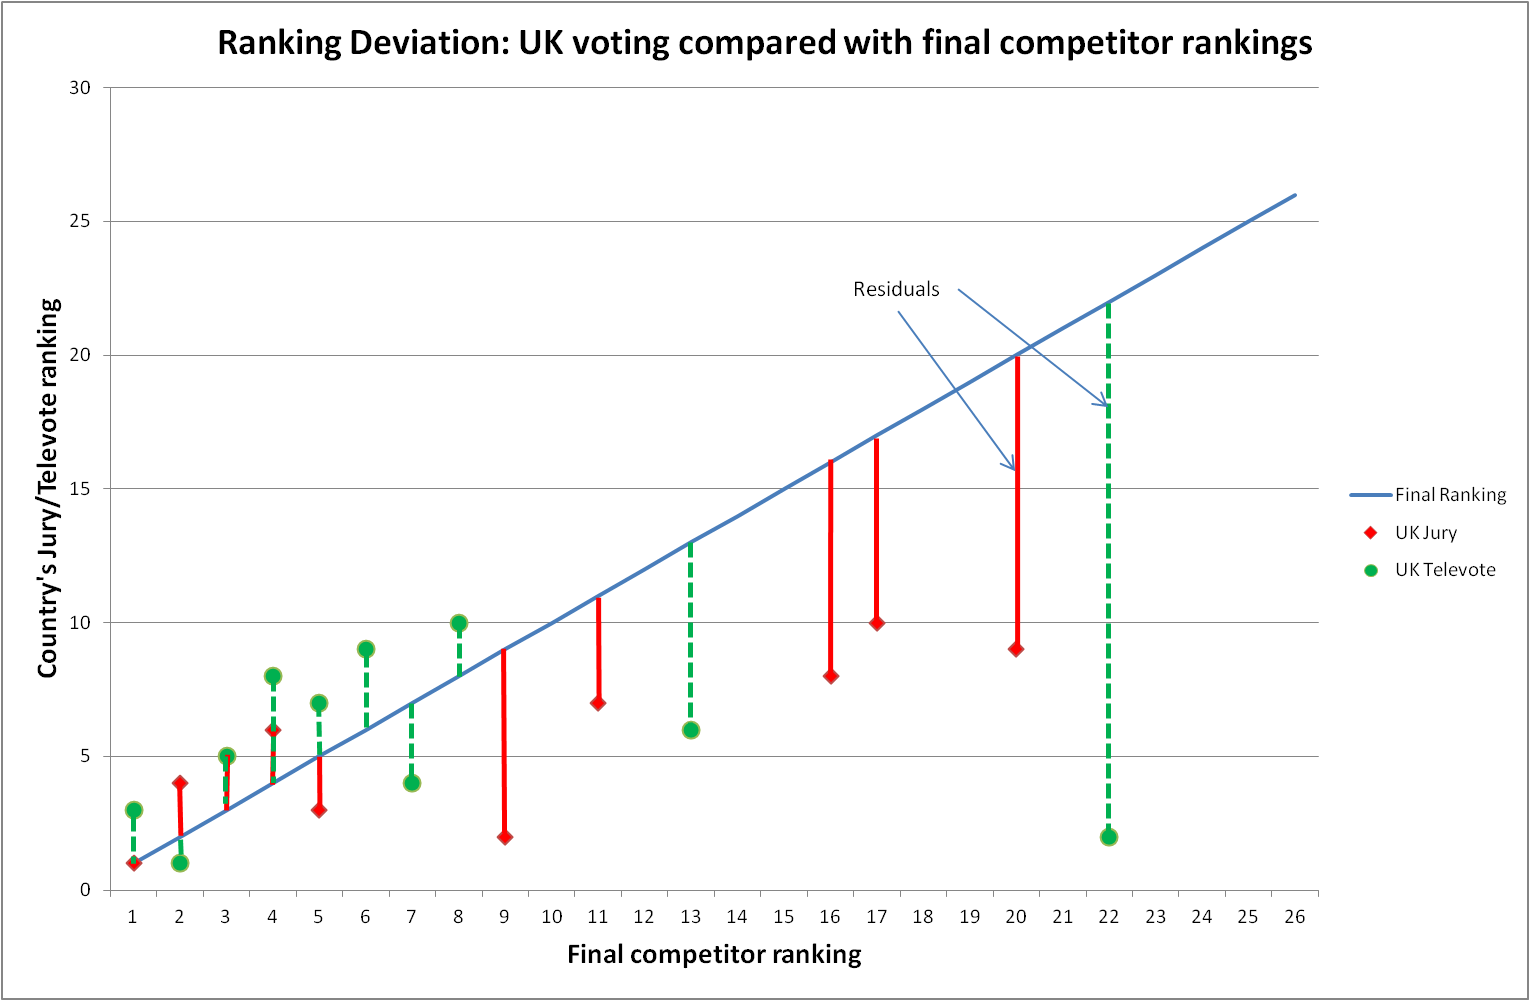
The figure to the left graphically shows the Ranking Deviation (or difference). The length of each vertical bar represents the difference of 'country vote' rank from each competitor's final position (the green bars are the deviation of the UK Televote ranking from the final position and the red bars the UK Jury vote). These differences are commonly referred to in statistics as residuals. The diagonal line is the baseline comparator - if a country vote exactly matched the final competitor positions the plotted points would lie on this line and the difference (residual) would be zero. The following graphs show the results of applying these methods of measuring the difference.
Figure 1: Differences (Residuals) between final competitor positions and (1) UK Jury and (2) UK Televote rankings
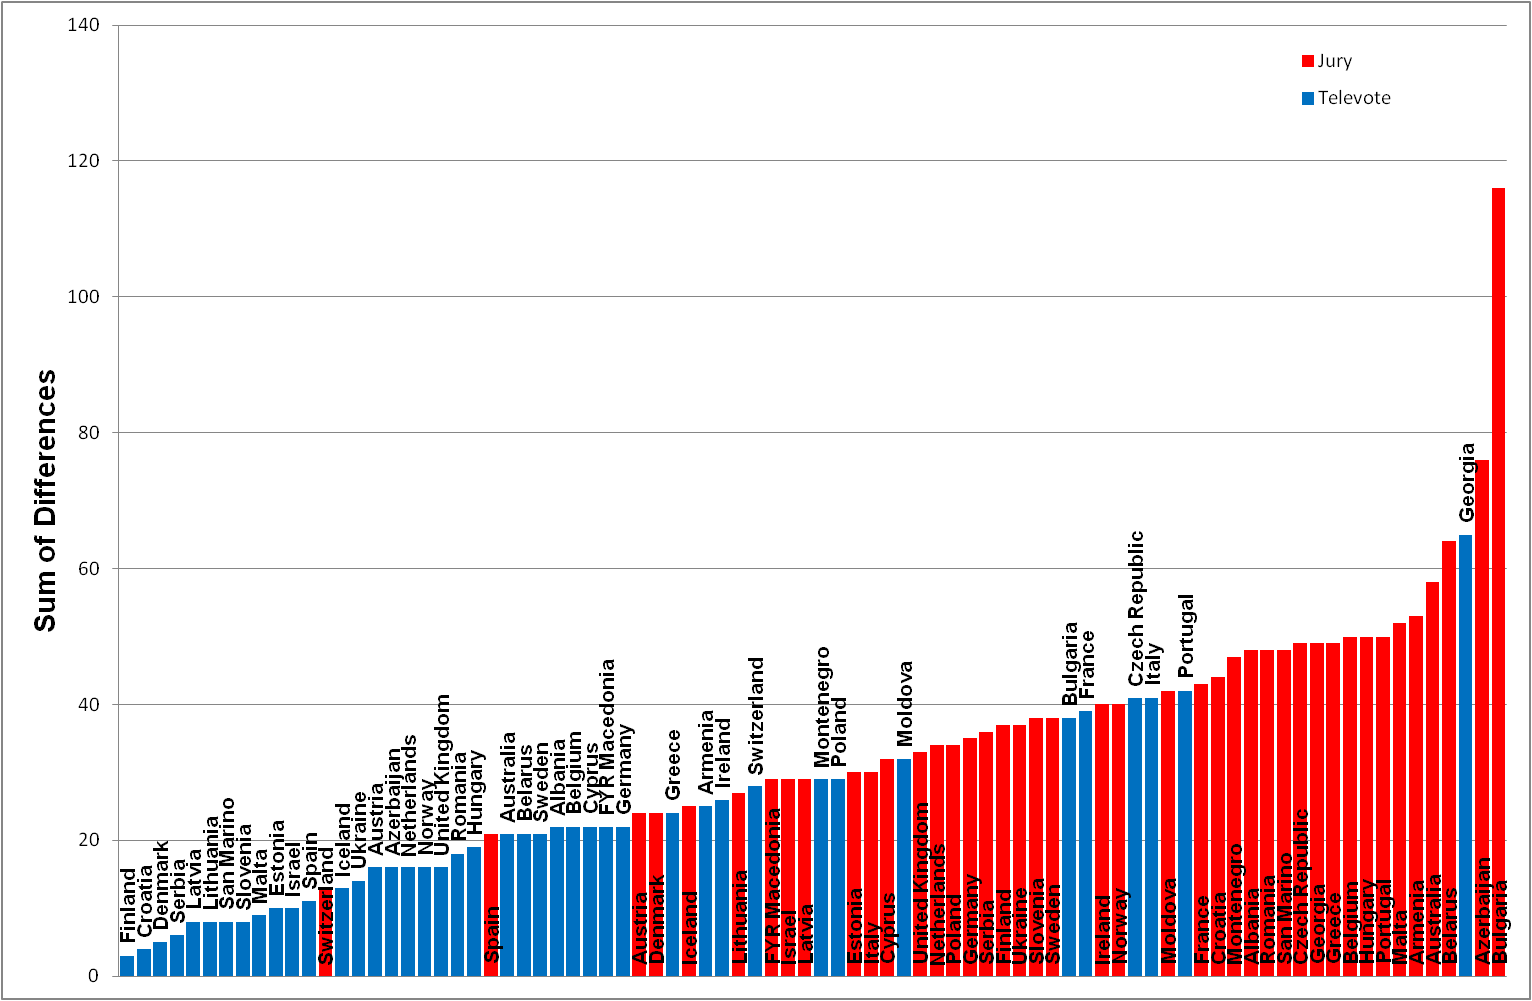
In each of the following graphs I have calculated the differences [1] (Figure 2), absolute differences [2] (Figure 3), square of differences [3] (Figure 4) and mean square of differences [4] (Figure 5) for ALL country votes. The red bars represent the Jury votes and blue bars the national Televotes. The vertical bars represent the measure of difference or deviation - the shorter the bar the closer the country vote to the final competitor rankings.
Figure 2 is a representation of case [1] - 'simple differences'. The results are misleading because while there are clearly differences (as observed by the residual bars in Figure 1), the points above (positive) and below (negative) counteract one another and, when added, under-estimate the overall deviation.
Figure 2: Ordered list of country votes based on sum of differences (Jury/Televote rank - competitor rank)
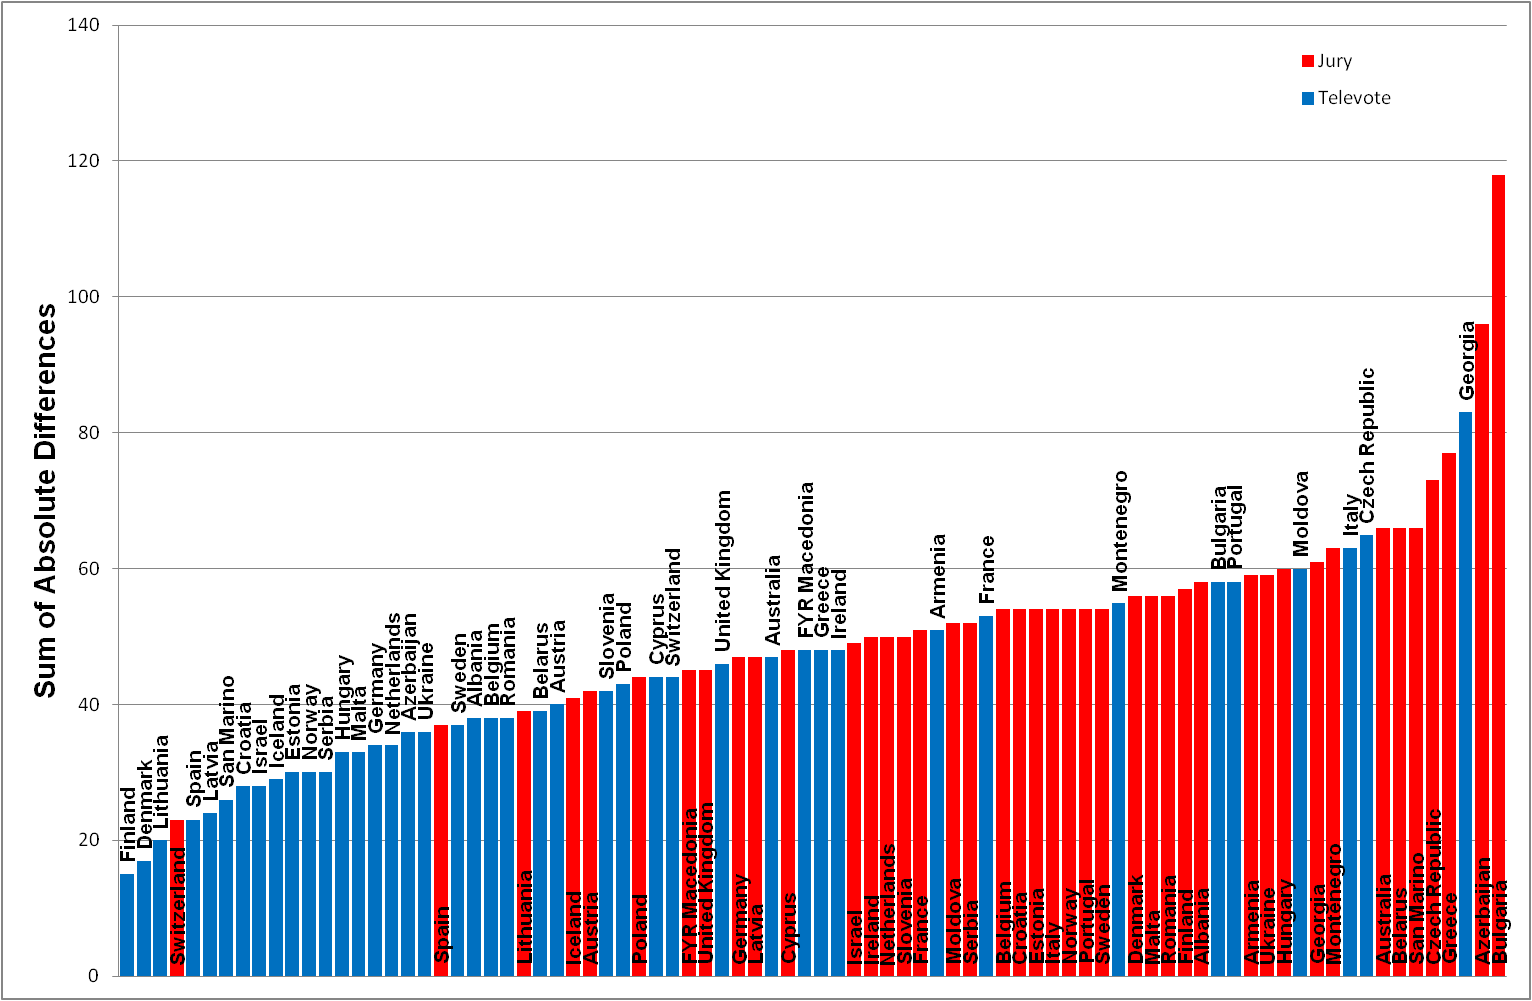
An inspection of the order of specific countries in Figures 2 and 3 can be revealing. The Croatia televote is shown as second in Figure 2 but eighth in Figure 3, indicating the 'simple difference' approach has under-estimated the scale of the deviation. The order of the UK votes also changes dramatically. Based on 'simple differences' the UK televote is ranked 20th and the jury vote 49th whereas the televote becomes 37th and the jury vote 36th when using 'absolute differences'.
The tables above of UK data stated the Jury and Televote 'absolute differences' were of similar value (45 and 46 respectively) but a visual inspection of Figure 1 shows there are 5 distinctive red 'Residual' bars of medium length and 2 green 'Residual' bars of longer length. A conclusion might be that 'absolute differences' are not effectively representing the scale or measure of distribution variability.
Figure 3: Ordered list of country votes based on sum of absolute differences (ABS(Jury/Televote rank - competitor rank))
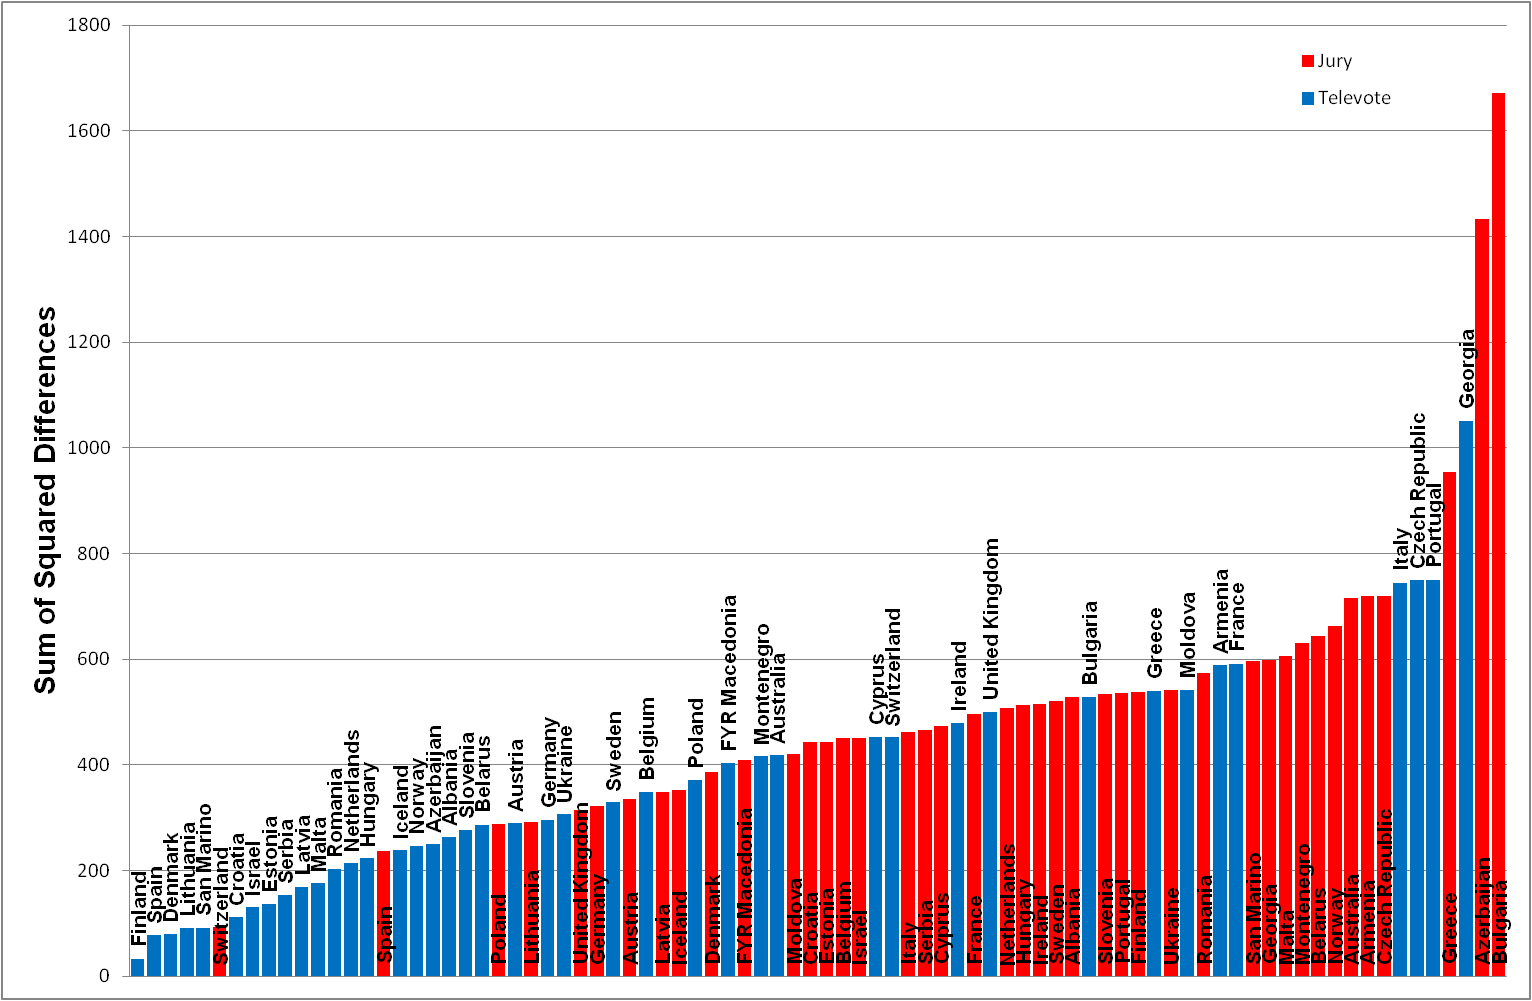
Figure 4: Ordered list of country votes based on sum of squared differences (Jury/Televote rank - competitor rank)2
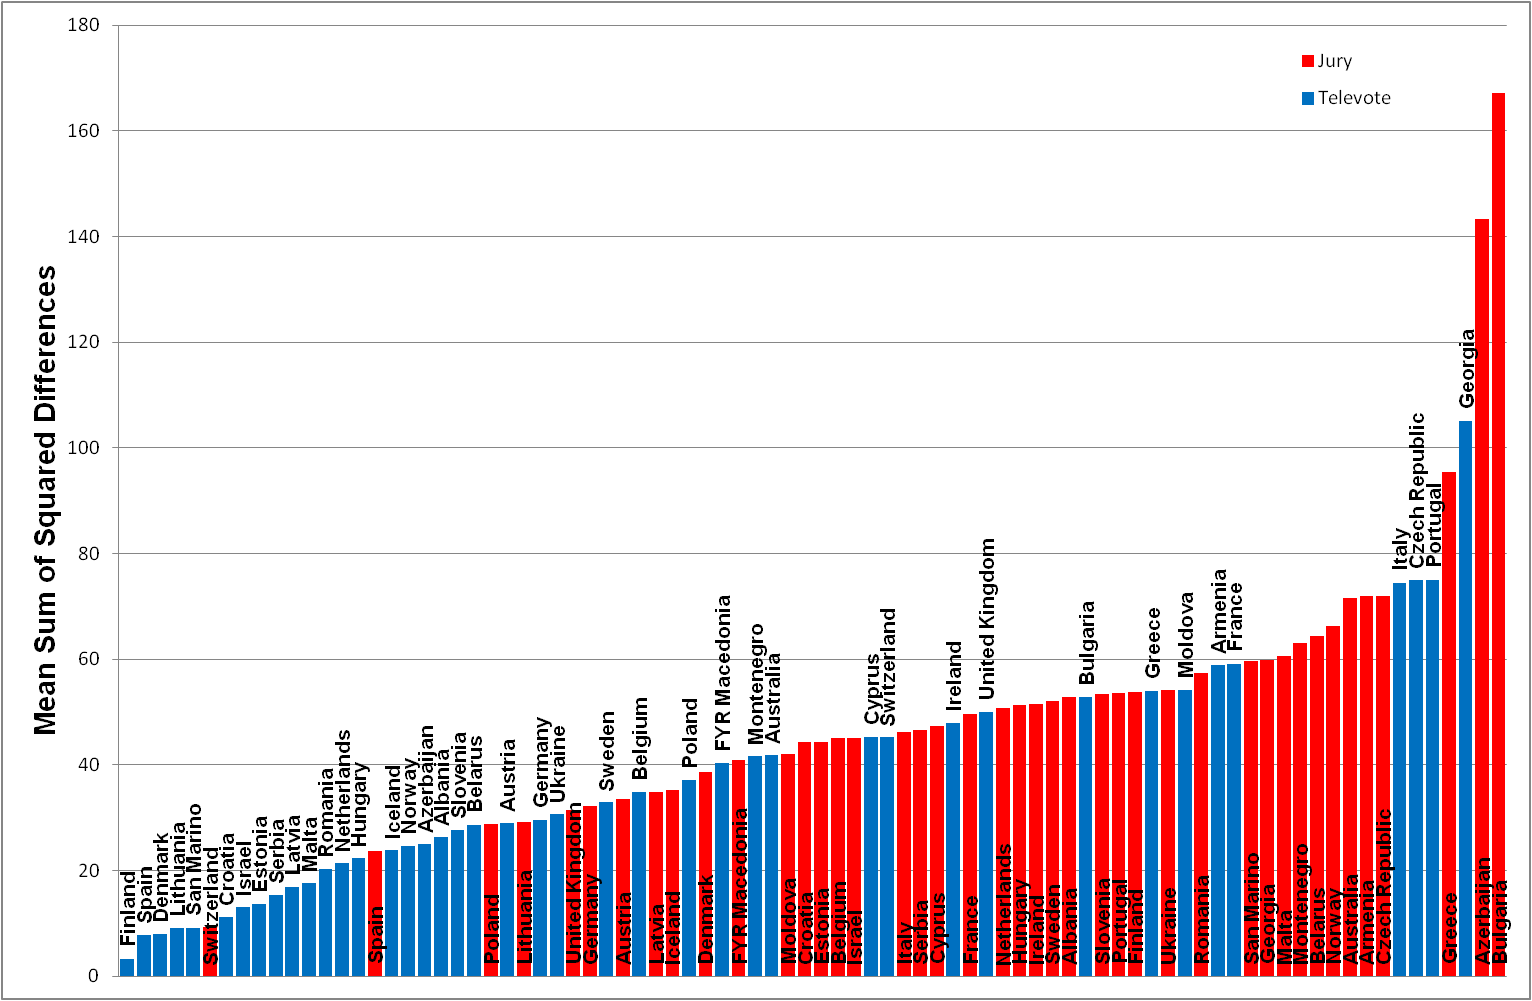
The mean sum of squared differences analysis (Figure 5) does not change the order of countries (compare with Figure 4) but calculates an average value of deviation for each 'country vote'.
Figure 5: Ordered list of country votes based on sum of mean squared differences (Jury/Televote rank - competitor rank)2 / 10
It is important to note that the scores we're evaluating from each country are contributing to the cumulative final result and therefore is itself influencing the outcome (i.e the final competition ranking is not independent of each country's vote). In this case, each vote is creating bias but as each country vote only accounts for 1.2% of the total (1 out of 84 votes) this effect is negligible but more importantly the analysis is only focusing on relative alignment of differences (e.g. is Finland's televote a better representation of the final outcome than Bulgaria's jury?).
One factor that does have an impact is that national juries and televotes cannot vote for their own country. For the 26 competing countries this has the disadvantage that if their final position is in the top 10 this voting retriction will be responsible for at least one residual and increase the scale of difference.