Case Study: Data Wrangling for Data Science jobs
As an aspiring data scientist professional, common questions that are posed include:
There are some useful reports that provide insights to some of these subjects [see References] but these lack the ability for interested parties to delve deeper and information, that is initially current, ages rapidly. The vision here might be for one or more analytical tools which can tap the job market to answer these questions on demand.
The work presented here has two purposes. One goal is to share my findings from this investigation of the job market. The other is to explain the steps I’ve followed to meet this challenge as an illustration of the activities required and the common issues which need to be overcome in a typical data mining and analysis project.
Problem Statement / Project Goal
In order to set a clear direction for the study and ultimately to judge whether the project has been successful it is important that goals are clearly defined and, where appropriate, measurable. It can be helpful to consider establishing SMART objectives (i.e. targets that are Specific, Measurable, Achievable, Relevant and Time Bound). This simple exercise can prove valuable - gauging whether goals are practical or realistic and whether they might need refinement.
For example, as there is no single source of (Data Science) job opportunities and with vacancy adverts appearing across a plethora of websites, other media channels and via word-of-mouth it would not be feasible to obtain a comprehensive view of the job market or even to accurately quantify what proportion of the total market is readily available to analyse. Therefore, rather than having a goal to determine the absolute number of vacancies the focus will be on assessing the indicative levels of jobs and the relative number of positions advertised over time. To this end there would be a requirement to conduct the information gathering and analysis work regularly indicating the need for an automated, rather than manual, solution.
A common observation with job websites is that roles can remain advertised for many months – in some cases because the positions remain unfilled and sometimes because the advertiser likes to leverage ‘attractive’ adverts long after they are applicable as a means of drawing potential candidates to their site. To address this it might be advisable to restrict jobs to those advertised within a recent period (say the last 14 days) or those which have not passed a closure date, where these attributes are available for the job.
My personal interest is in jobs available in the UK which constrains the scope of research. However, the principles I’ve followed should be repeatable for other regions and countries. So the initial objective I’ve set is:
“I want an automated capability that can be run on demand and can provide a list of current (advertised in the last 14 days) job vacancies in the UK for Data Science related positions containing details of the agency / employer, the job location, salary and the skills and experience required.”
As we progress through the subsequent analytical steps some refinement of this vision may be necessary.
Data Source(s)
So from where can relevant data be sourced? The acknowledged route for advertising most high tech roles is company and agency web sites (Job Boards) and there are many to choose from. It would not be practical (with limited resources) to locate and use all such sources so a pragmatic approach to identifying the ones most suitable to achieving the goal is needed. In data mining tasks typical considerations of sources include:
- ACCESSIBILITY: How easy is it to access the data source? For example, some websites require user authentication or registration. Others offer APIs (Application Programming Interfaces) or mechanisms (e.g. JSON (Javascript Object Notation)) that facilitate user queries on the data
- AVAILABILITY: A slight variance on accessibility, is information readily and continuously available or are interruptions to service experienced?
- CHURN / CURRENCY: Is the information up-to-date and frequently refreshed or is data obsolete? Is it possible to evaluate how recently the data was posted or reviewed by the provider?
- COMPLETENESS: How comprehensive is the data source in relation to the problem being investigated? This judgement may require some subjectivity but simple volume measures (e.g. number of jobs being advertised) and range of job attributes provided (e.g. date posted, job location) may offer an insight
- REPRESENTATIVENESS: How suitable are the data sources in the context of the questions being posed? What is the scope and coverage (e.g. geography, topics) of the sources?
- RELIABILITY / INTEGRITY: What level of trust and confidence do users place in the quality of the source? Is it authoritative? Is it known to include errors or bias?
- DATA LINEAGE: What is the provenance of the data? i.e. what is the original source and are there any intermediaries handling the data? Each step from the source heightens the risk of data mutation and the introduction of inaccuracies or loss of detail. Some sites re-advertise jobs listed on other websites.
The analyst needs to weigh up these factors and judge the acceptability of each source.
For this study I have selected some specific feature requirements for testing the appropriateness of a range of website sources. The following table indicates whether each feature is or is not present in an accessible and structured format. The table does not represent an exhaustive list of recruitment website sources but is illustrative of the different categories available – for example, (i) specialist role websites, (ii) general job sites which host adverts on their own website, (iii) general job sites which redirect users to another website where the position is advertised, and (iv) websites offering jobs for a specific locality or region.
For the purposes of this investigation the keywords used to search for relevant jobs were ‘Data Scientist’, ‘Machine Learning’ and ‘Artificial Intelligence’. As will be demonstrated later, these seed terms yield a variety of different Data Science (and non-Data Science) related roles from the job sites. The number of job matches (Volume) is misleading because most (generic) job site search engines are not context aware - their basic text string comparisons frequently yielding inappropriate results (e.g. Machine Operator roles).
| Coverage | Volume | Employer / Agency | Role | Location | Salary | Description | Age | Category | |
|---|---|---|---|---|---|---|---|---|---|
| www.brightpurple.co.uk | National | <10 | ✔ | ✔ | ✔ | ✔ | ✔ | ✔ | |
| www.bristowholland.com/jobs | Regional | 0 | ✔ | ✔ | ✔ | ✔ | ✔ | ||
| www.cityjobs.co.uk | National | 10 - 100 | ✔ | ✔ | ✔ | ✔ | ✔ | ✔ | |
| www.contractoruk.com | National | 500 - 600 | ✔ | ✔ | ✔ | ✔ | ✔ | ||
| www.cv-library.co.uk | National | 600 - 700 | ✔ | ✔ | ✔ | ✔ | ✔ | ✔ | |
| www.cwjobs.co.uk | National | 400 - 500 | ✔ | ✔ | ✔ | ✔ | ✔ | ||
| www.datascientistjobs.co.uk | National | 10 - 100 | ✔ | ✔ | ✔ | ✔ | ✔ | ✔ | |
| uk.dice.com | National | 3000 - 3100 | ✔ | ✔ | ✔ | ✔ | ✔ | ✔ | ✔ |
| www.ecmselection.co.uk | Regional | 200 - 300 | ✔ | ✔ | ✔ | ✔ | ✔ | ||
| www.experteer.co.uk | National | 1900 - 2000 | Requires registration | ||||||
| www.fish4.co.uk | National | 200 - 300 | ✔ | ✔ | ✔ | ✔ | ✔ | ✔ | ✔ |
| m.hays.co.uk (*) | National | 500 - 600 | ✔ | ✔ | ✔ | ✔ | ✔ | ||
| www.hurrenandhope.co.uk | Regional | 0 | ✔ | ✔ | ✔ | ✔ | ✔ | ✔ | |
| www.indeed.co.uk | National | 9000+ | ✔ | ✔ | ✔ | ✔ | ✔ | ||
| www.interquestgroup.com | National | 10 - 100 | ✔ | ✔ | ✔ | ✔ | |||
| www.ivyexec.com | Requires registration | ||||||||
| uk.jobrapido.com | National | 2400 - 2500 | ✔ | ✔ | ✔ | ||||
| www.jobsite.co.uk | National | 1500 - 1600 | ✔ | ✔ | ✔ | ✔ | ✔ | ||
| www.monster.co.uk | National | 3000+ | ✔ | ✔ | ✔ | ✔ | ✔ | ✔ | ✔ |
| www.osr-recruitment.co.uk | Regional | 1 - 10 | ✔ | ✔ | ✔ | ✔ | ✔ | ||
| www.pertemps.co.uk | National | 1300 - 1400 | ✔ | ✔ | ✔ | ✔ | ✔ | ✔ | |
| www.prs.uk.com | Regional | <10 | ✔ | ✔ | ✔ | ✔ | ✔ | ||
| www.reed.co.uk | National | 1900 - 2000 | ✔ | ✔ | ✔ | ✔ | ✔ | ✔ | |
| jobs.theguardian.com | National | 100 - 200 | ✔ | ✔ | ✔ | ✔ | ✔ | ✔ | ✔ |
| www.totaljobs.com | National | 2700 - 2800 | ✔ | ✔ | ✔ | ✔ | ✔ | ✔ | ✔ |
| www.venngroup.com | National | <10 | ✔ | ✔ | ✔ | ✔ | ✔ | ✔ | |
| www.workcircle.co.uk | National | 1500+ | ✔ | ✔ | ✔ | ✔ | |||
| zoek.uk | National | 100 - 200 | ✔ | ✔ | ✔ | ✔ | ✔ | ||
Information accurate as at April 2018
(* Technical implementation uses client-side webpage generation making web-scraping difficult)
With no single source meeting our needs the natural conclusion is that the content of multiple websites should be combined to form an aggregated dataset which can be interrogated. As each agency or company website will have a unique HTML / CSS structure a bespoke web scraping programme will need to be developed for each. Therefore, the choice of websites to use should be optimised to achieve the largest number of unique jobs whilst minimising the number of sources which need to be accessed. The key criteria for selecting websites was volume of relevant jobs, feature coverage and ease / practicality of accessing the data through Python webscraping. Following research into each website I have started this project using the following job boards: Contractor UK, CV-Library, CW Jobs, Indeed, Job Site, Monster, Reed, Total Jobs, UK Dice and Work Circle. To be able to amalgamate sources care must be taken to ensure datasets are compatible (i.e. generated in a consistent manner, have the same format, are contemporaneous) and a further challenge is that duplicates (i.e. the same job advertised by different agencies) must be identified and eliminated.
Data Extract
Once the data source or sources have been confirmed a more detailed analysis of the access method, interface, data structure and technologies involved must be conducted. This provides the information required to develop the data extract mechanisms. In addition to the Data Source considerations, aspects that should be assessed for data extraction projects include:
- APIs: Does a machine readable interface exist? Does it adhere to standard, open source or proprietary protocols?
- FILE TYPE FORMATS: Is the data highly structured (as in a Relational Database Management System), semi-structured (e.g. HTML tagged webpages) or unstructured. This will dictate the complexity of the data extraction mechanism;
- FIELD LABELLING: Is it clear from the naming convention in the source what each data element represents? Is the data source reliable or are there instances of data being mislabelled or categorised (e.g. Salary appearing in Location field);
- FIELD FORMATS: What elemental field types are used (i.e. text, date/time, numeric, currency, boolean)? Are the fields quantitative (e.g. numeric), qualitative (e.g. text) or a combination?
- PERFORMANCE: Relevant factors are the volume of data to be copied, network capacity / bandwidth, transfer rates, processing times etc. A consideration for our project is the number of web pages which may need loading.
For enterprise systems, SQL Server Integration Services (SSIS) is a common tool deployed to handle data Extract, Transformation and Loading (ETL). However, for web-scraping from internet sources one of the tools of choice is Python. Although we need to deal with multiple distinct website formats, structures and HTML tags for each Job Board the core structure of each Python programme will be similar. As in previous case studies, it is helpful to outline the core steps in the web-scraping programme (see Figure 1). On some Job Boards a query yields a webpage containing the required features of each job. However, in other cases the primary webpage returns only a skeleton of the job details and a link to another page which bears the detailed job description. The Python programme needs to be tailored to or cater for these different structures.
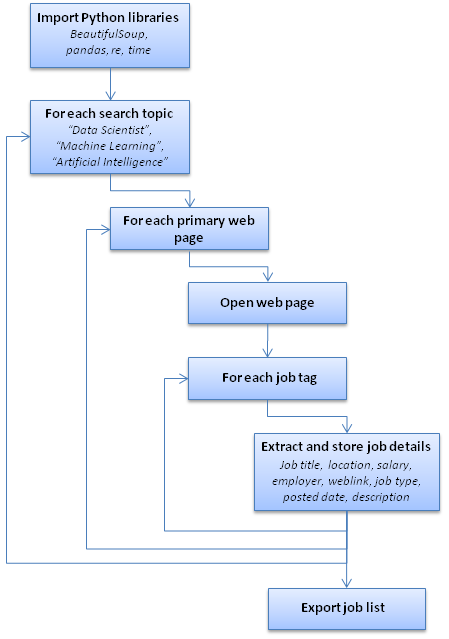
Figure 1: Job Board webscraping programme workflow
An example of a Python programme created to webscrape the job information from one Job Board and which follows the above schema can be downloaded from here (WebScraping - Indeed v3.ipynb). You will require Python Notebook to open this file (see Python & Anaconda).
Extract-Transform-Load (ETL) Analysis and Reflections
The tailored Python programmes were run for each of the targeted job websites and the multiple structured datasets obtained (in CSV format) were combined into a single file (in this case using Excel). Over 15,500 job entries were obtained but from scrutiny of the data it was obvious there were repeated entries (with the same vacancies being advertised on different websites and, in the case of 'Indeed', the same jobs appearing multiple times) and many adverts that had no relevance to Data Science. To produce a usable dataset extensive analysis, reference mapping, data cleaning and record comparisons were required.
Manual corrections to the dataset were required to address readily identifiable problems, for example, where websites had inadvertently interchanged the information in the ‘posted date’, ‘salary’ and ‘job type’ fields. The website HTML tags were wrongly populated.
Each unique job title was reviewed and the terms assessed for relevance to Data Science (e.g. “Kafka Data Engineer” retained, “Yard Manager” removed). Specific keywords (such as AI, Algorithms, Artificial Intelligence, Big Data, Data Engineer, Data Mining, Data Scientist, Decision Scientist, Deep Learning, Machine Learning, Matlab, ML, NLP, Python, R, Robotics) were indicators of appropriate roles. Each of the 4,000 shortlisted jobs was mapped to a ROLE CATEGORY (see table below) derived from the respective job titles. This demonstrates the breadth of business and academic opportunities with Data Science related specialisms.
| AI Analyst | Data Scientist | Head of Engineering | Product Design Engineer | Sales Manager |
| AI Architect | Decision Scientist | Insight Analyst | Product Manager | Scrum Master |
| AI Engineer | Deep Learning Engineer | Instructor | Project Manager | Site Reliability Engineer |
| Algorithm Engineer | Deep Learning Research | IT Auditor | Quality Assurance Engineer | Software Architect |
| Algorithm Researcher | Deep Learning Scientist | IT Delivery Manager | Quant Analyst | Software Developer / Engineer |
| Business Analyst | DevOps Engineer | Lecturer | R&D Engineer | Solution Architect |
| Business Development Manager | Digital Analyst | Linux Systems Engineer | Recruitment Consultant | Statistical Science Director |
| Chief ML Scientist | Digital Enablement Consultant | Machine Learning Analyst | Release Engineer | Systems Administrator |
| Data Analyst | Engineering Analyst | Machine Learning Engineer | Researcher | |
| Data Architect | Head of AI | NLP Engineer | Robotics Engineer |
Additionally, where available, each job was mapped to a ROLE LEVEL (e.g. Graduate, Junior, Senior, Lead, Head, Principal, Director, Chief) based on text within the job title. This would allow investigation of the numbers / proportions of roles of each type and their respective salary ranges to be analysed.
There was considerable variety in the manner salary information was presented and in many cases no remuneration details were available. A macro was written (using the Salary and Description fields) to determine the currency (by identifying occurrences of identifiers such as ‘£’, ‘$’, ‘€’), the frequency of payments (hour, day, week, month, year considering the various ways each could be expressed e.g. ‘pa’, ‘per annum’, ‘per year’ ‘/year’) and the minimum and maximum payment values (as most provided salary ranges e.g. ‘£40k - £75k pa’). Superfluous text (e.g. ‘+ Pension and 25 days holiday’) was ignored. The programmed rules managed to recognise and address most common expressions but some entries required manual inspection and transformation. By conforming the payments into a currency, frequency and range it was possible using currency conversion values and assumptions about typical working periods (e.g. 7.5 hours / day) to conform the salaries.
The job locations on each website were entered as ‘free text’ leading to inconsistencies in spellings, geographic granularity and how the town and city names were defined (e.g. “Aberdeen”, “Aberdeen, Aberdeenshire”, “Aberdeen, Scotland”). In order to conform the location text, all unique strings were collated into a single (ordered) list and mapped to a master reference dataset of cities and countries.
The list of employers or agents advertising each post (where information was available) were similarly mapped to a standard set of business names (conforming different spellings or representations of the same organisation).
The combinations of mapped employer / agency, role title, job location, and salary (together with the description) allowed duplicate job adverts to be readily identified and removed. However, extensive manual validation was still required on the remaining jobs where one or more attributes were not available on the source Job Board and descriptions for the same job were expressed in different ways by respective agencies or in some cases truncated or abbreviated automatically by the advertising web site.
The original list of 15,500 jobs was reduced to an ‘exclusive’ list of 1,480 jobs on which the following analysis was performed.
Findings
Figure 2 displays box-plots showing the minimum, maximum, median, lower and higher interquartile salary ranges for the 535 Data Scientist jobs comparing the results for the whole group with those for which the subset had ROLE LEVEL information.
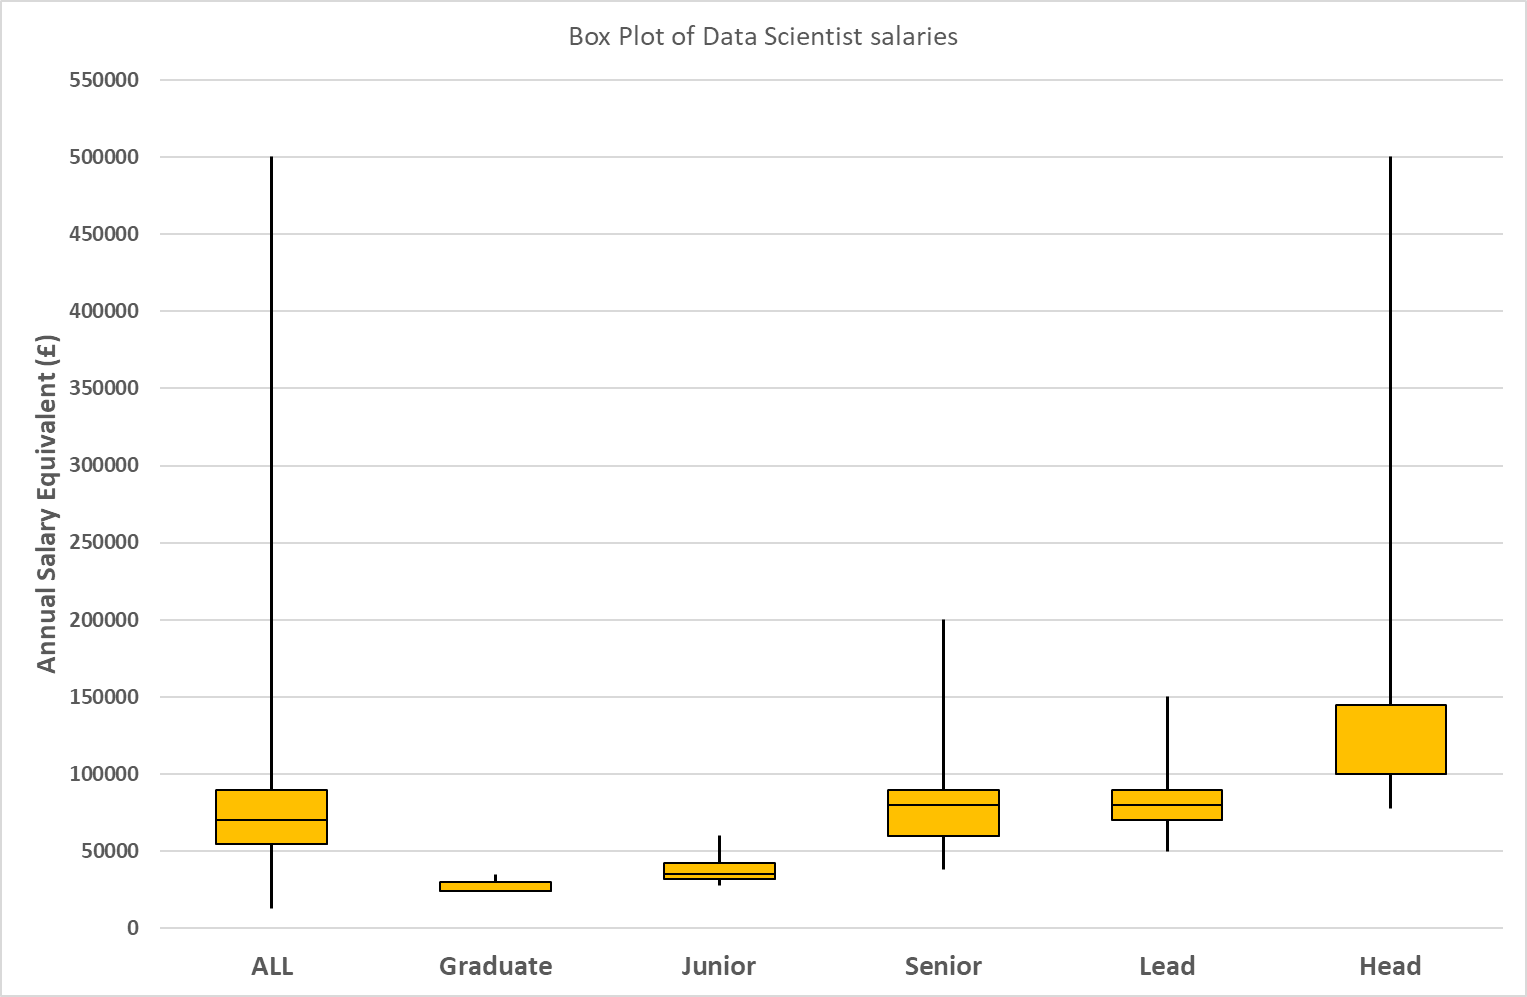
Figure 2: Box Plot of Data Scientist Job Salary ranges
Figure 3 compares the salary distributions of (535) Data Scientist, (121) Data Engineer, (106) Machine Learning Engineer and (99) Software Developer / Engineer jobs. Note the Salary range on the graph axis has been limited to £200K (whereas the maximum Data Scientist salary is £500K) in order to clearly show the minimum, lower quartile, median and upper quartiles for each job.
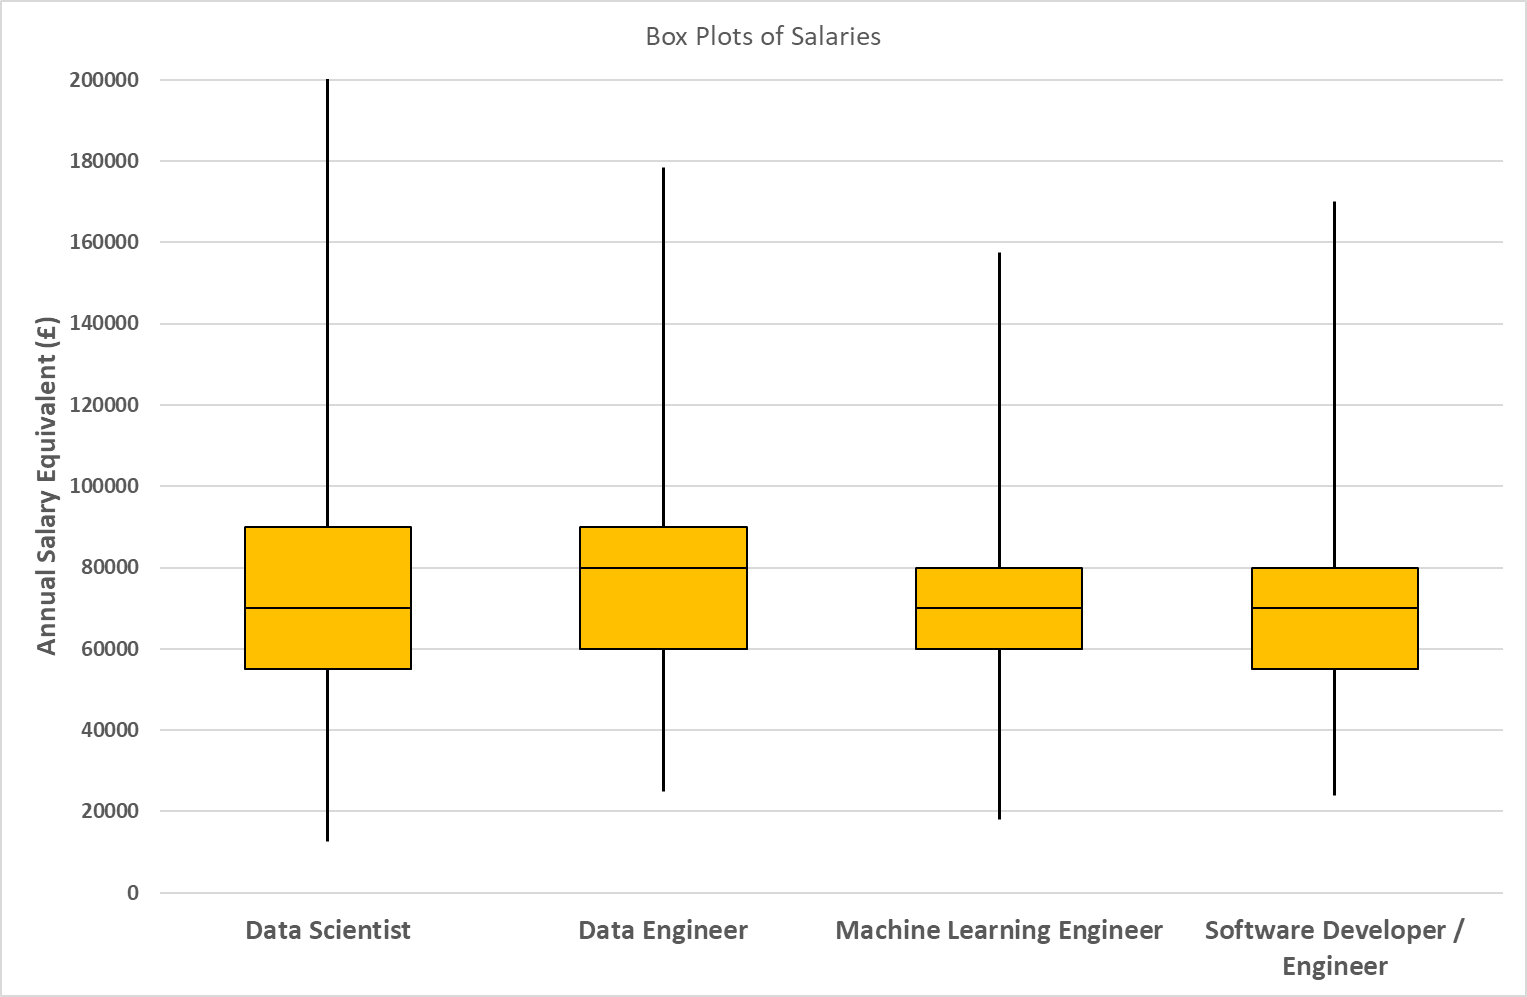
Figure 3: Box Plot comparison of Job Salary ranges for different roles (Data Scientist maximum salary not shown)
A programme was written to split the textual descriptions from the original 15,500 jobs into (~13,000) individual words or phrase strings which were then de-duplicated into a unique, ordered list. These were reviewed to identify and highlight keywords relating to Data Science and related disciplines. This was performed on the complete dataset to avoid losing keywords during the refinement process which created the shortlist of unique jobs. For each ROLE CATEGORY (e.g. Data Scientist) the relative frequency of these distinct keywords was calculated to gain an insight into what characterises each role and to understand what technologies, tools, products, packages, algorithms and skills are currently in demand.
Figure 4 shows the (ordered) relative frequency of keywords associated with Data Scientist roles compared with their relative frequency in relation to Data Engineer roles. Python importance is common to both whereas skills such as ‘R’ are mentioned more often for Data Scientist positions than Data Engineers.
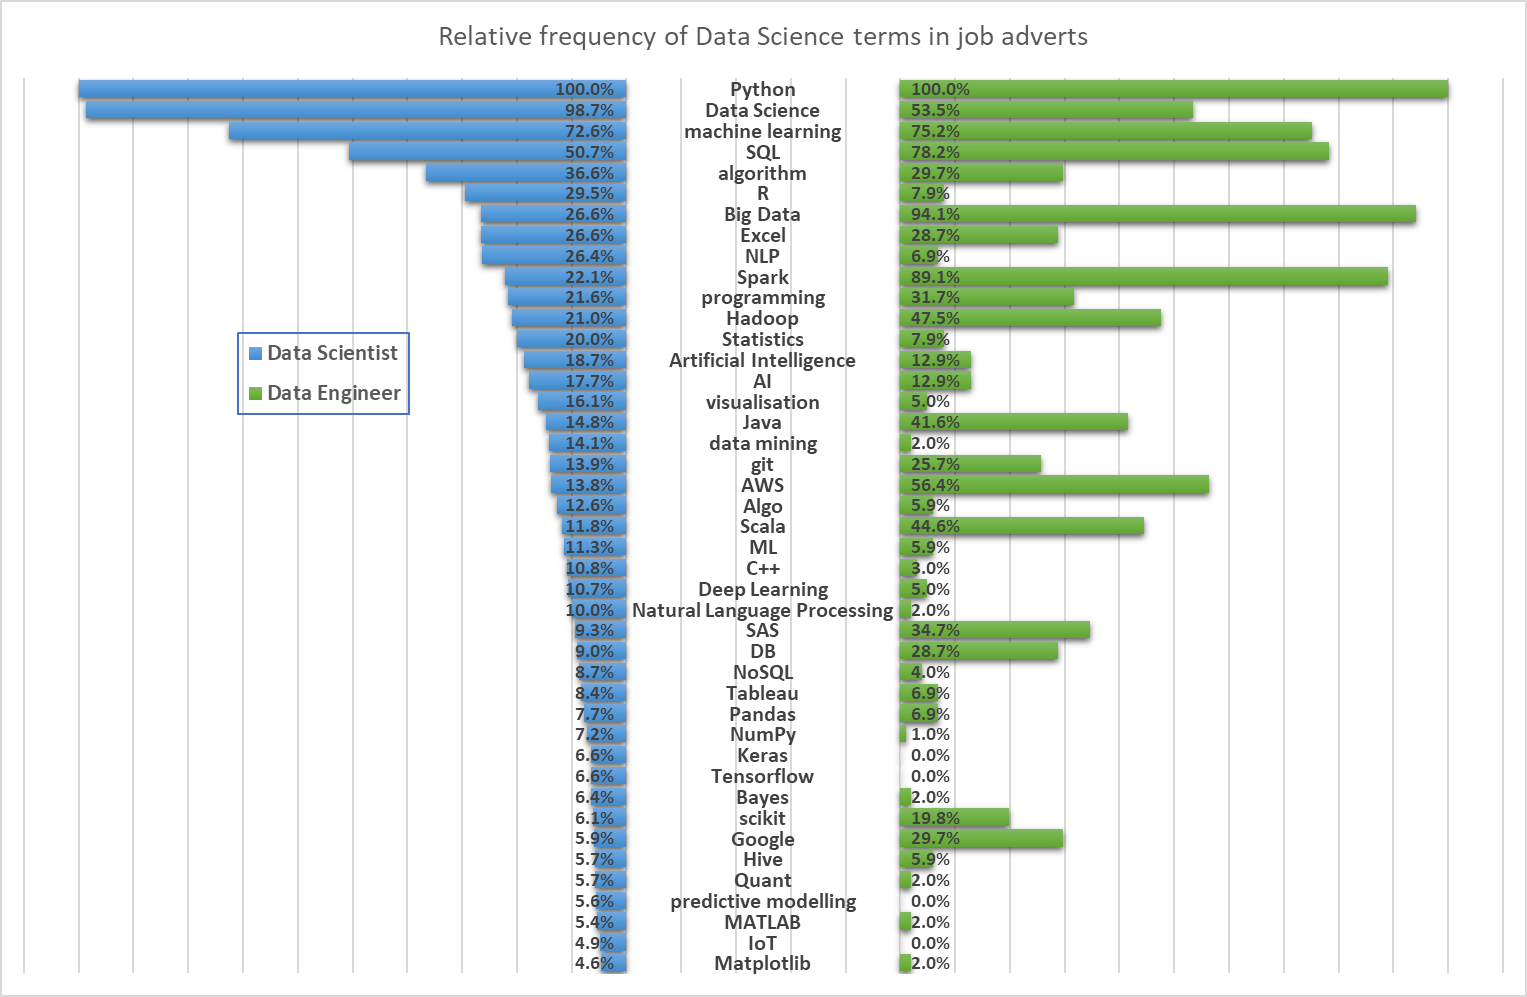
Figure 4: Population pyramid comparing term frequency in Data Scientist and Data Engineer job adverts
Figures 5, 6 and 7 show the complete list of keywords (ordered by relative frequency) included in jobs adverts for Data Scientists, Data Engineering and Machine Learning engineers respectively. Predominantly, there are some core technologies that characterise each job type (e.g. Python, Spark, SQL, C++, NLP) but there are also a lot of niche technology requirements that may be specific to the employer's environment and preferences. There were some adverts that contained a comprehensive list of technology 'buzzwords' - the lack of precise role requirements possibly demonstrating the client has no clear data architectural vision and their misunderstanding of what candidates could / should bring.
It would be interesting to read some of the articles listed below [see References] to consider how their views of the different roles align with these technology skill requirements.
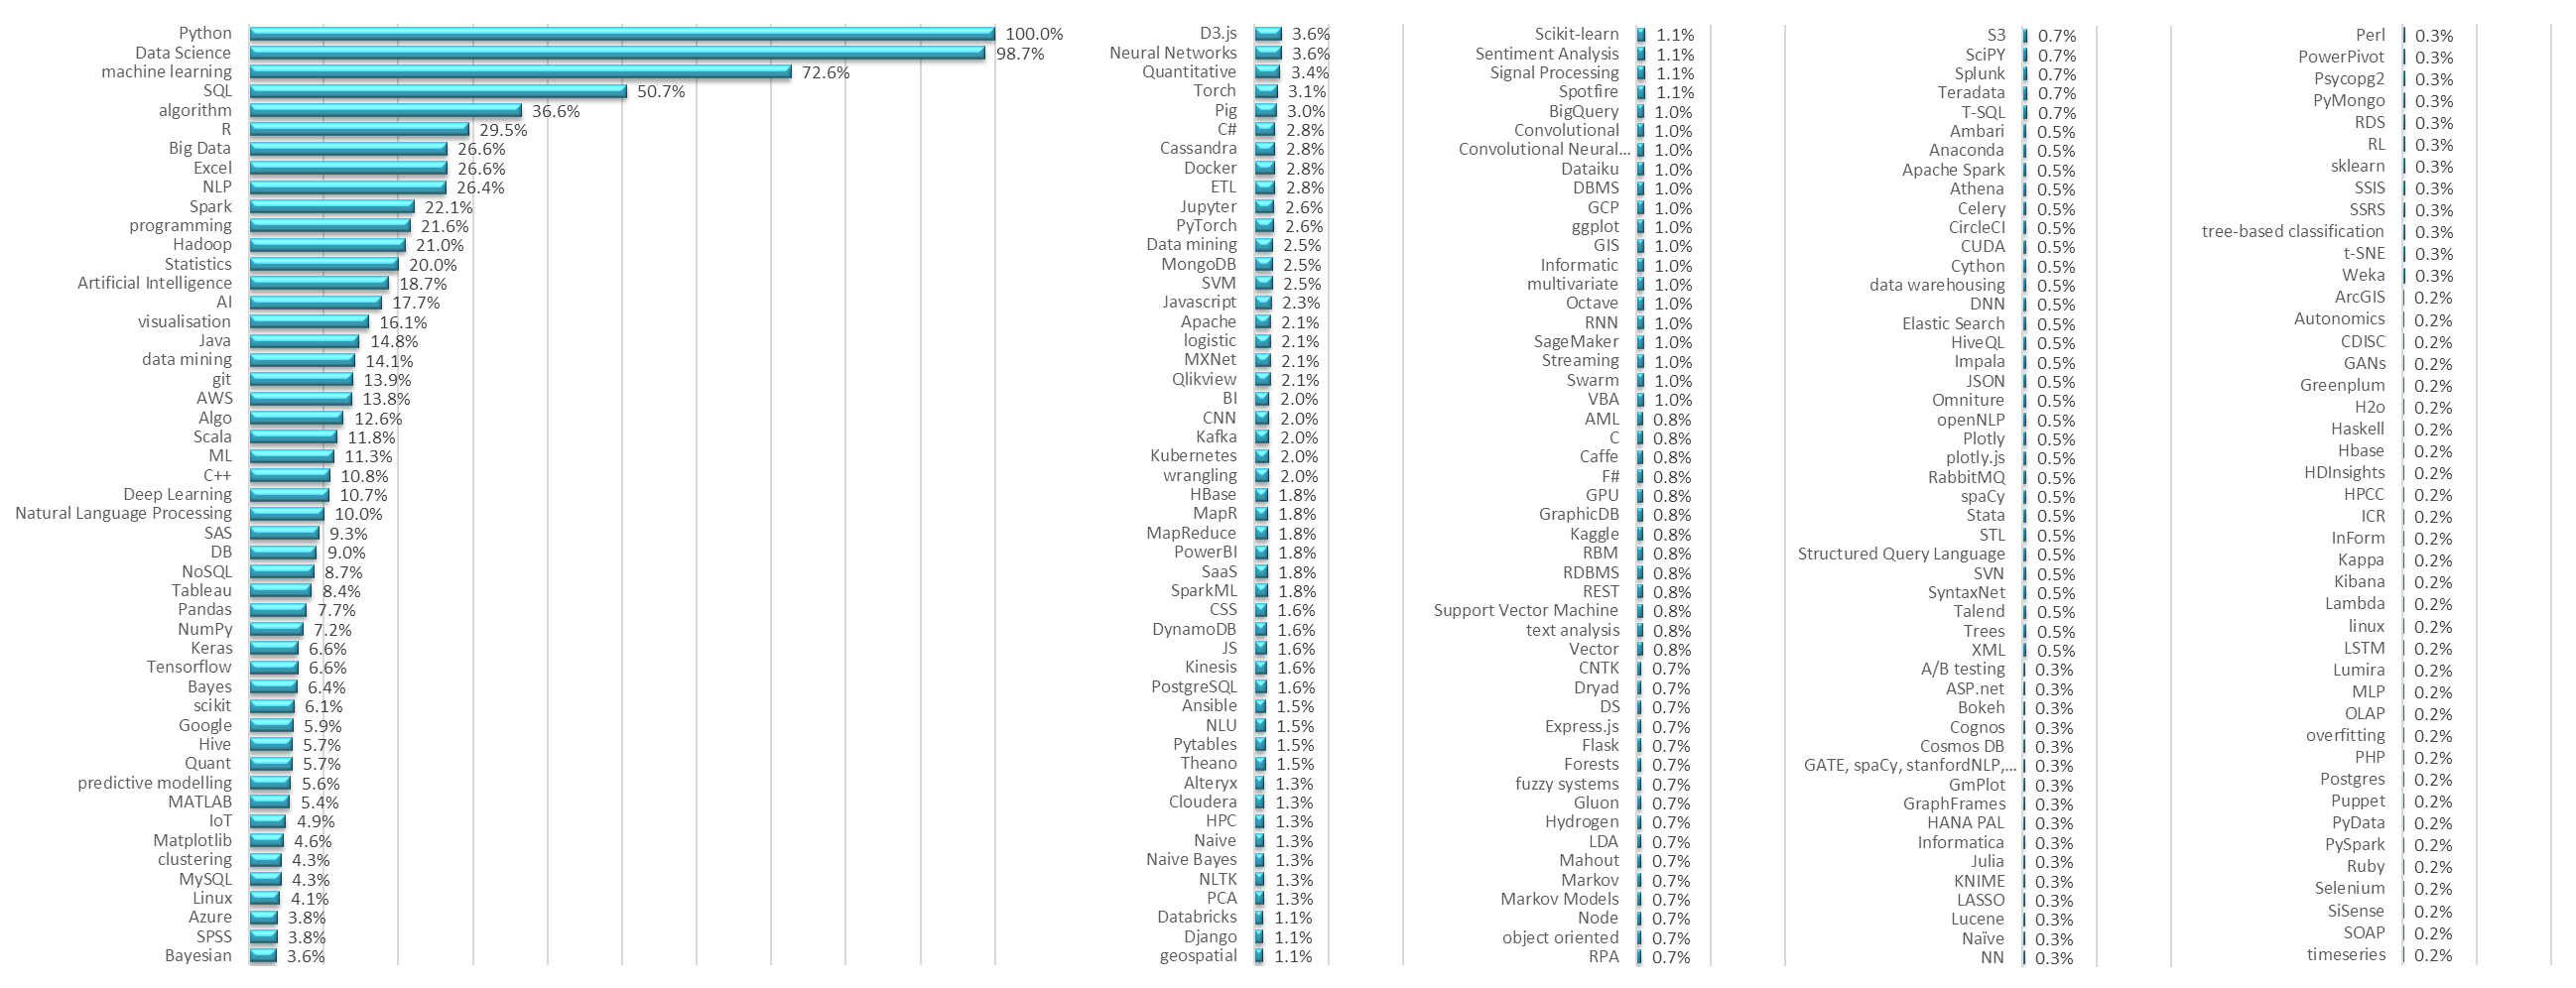
Figure 5: Relative frequency of keywords in Data Scientist job adverts
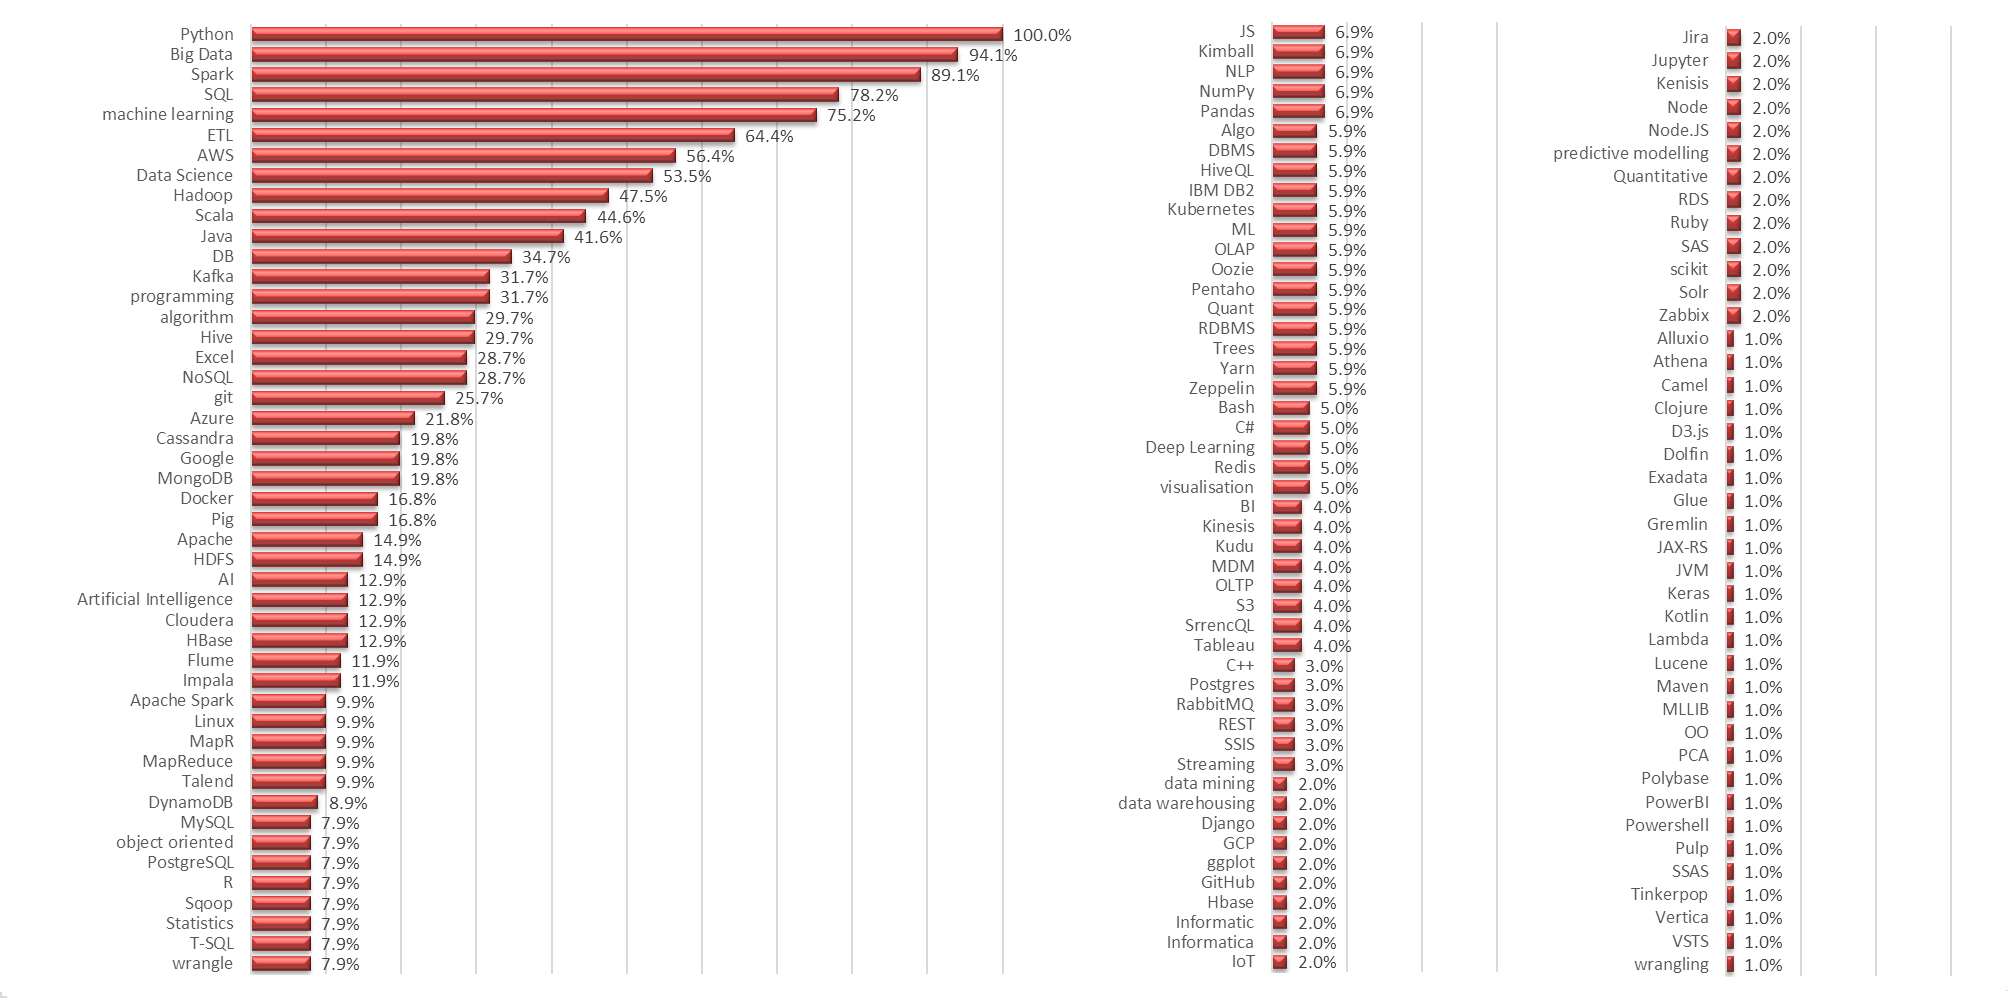
Figure 6: Relative frequency of keywords in Data Engineering job adverts
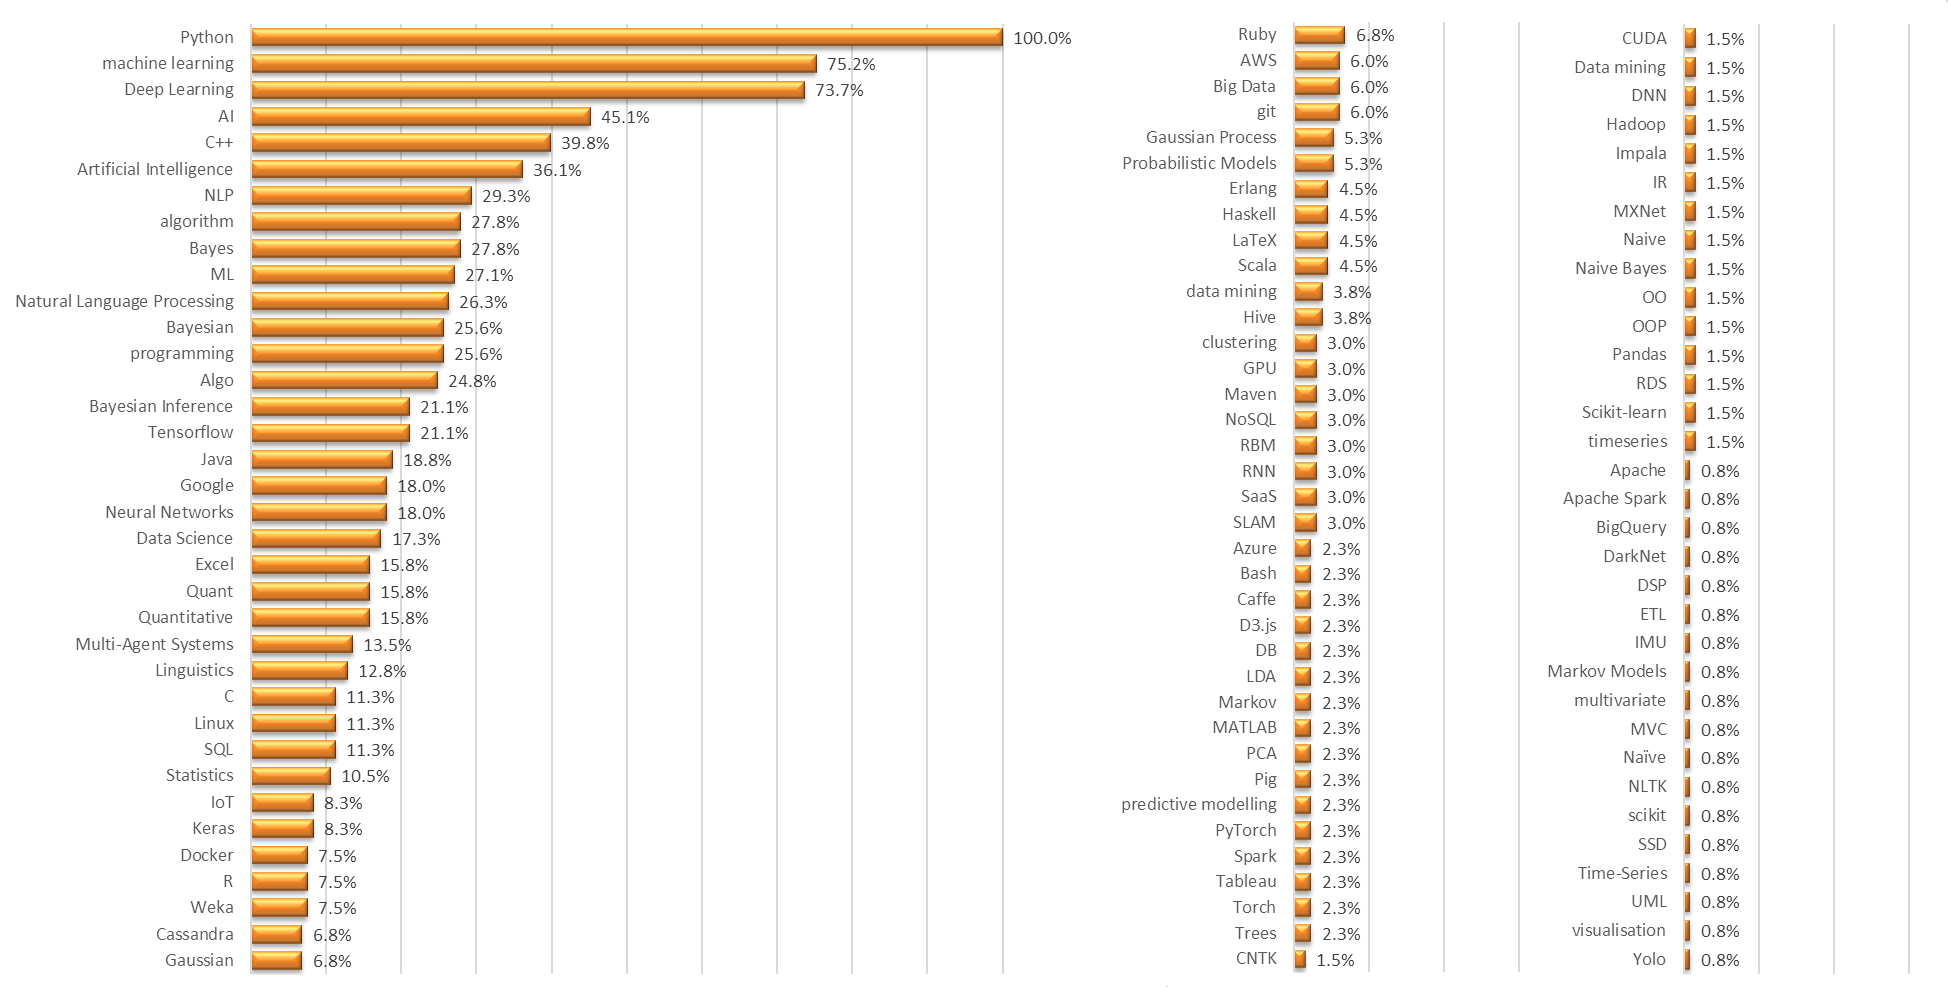
Figure 7: Relative frequency of keywords in Machine Learning Engineer job adverts
As a final study I felt it would be helpful to appreciate where the jobs for this extract were located. In addition to jobs for which no location was given, there were 64 adverts for international positions and 48 that were UK-based but where either the location was flexible or the city was not specified. For the remainder, the following maps plot the geographic locations for UK and Ireland jobs - marking the city / region provided in the advert followed by the number of jobs for that place in brackets (e.g. "Exeter (4)"). By far the largest concentration of jobs was London (with 869 positions) accounting for over 60% of all roles advertised. However, it is heartening to see businesses across the country seeking to grow their Data Science capabilities through recruitment.
Clearly, this is just a snapshot of job opportunities available at a point in time. Now that the web-scraping tools, data aggregation, cleansing and visualisation tools have been developed and reference data created it will be a straightforward task to repeat this exercise at future points in time to identify (relative) trends in numbers of adverts, technologies, salaries and job locations.

Figure 8A: Jobs in UK
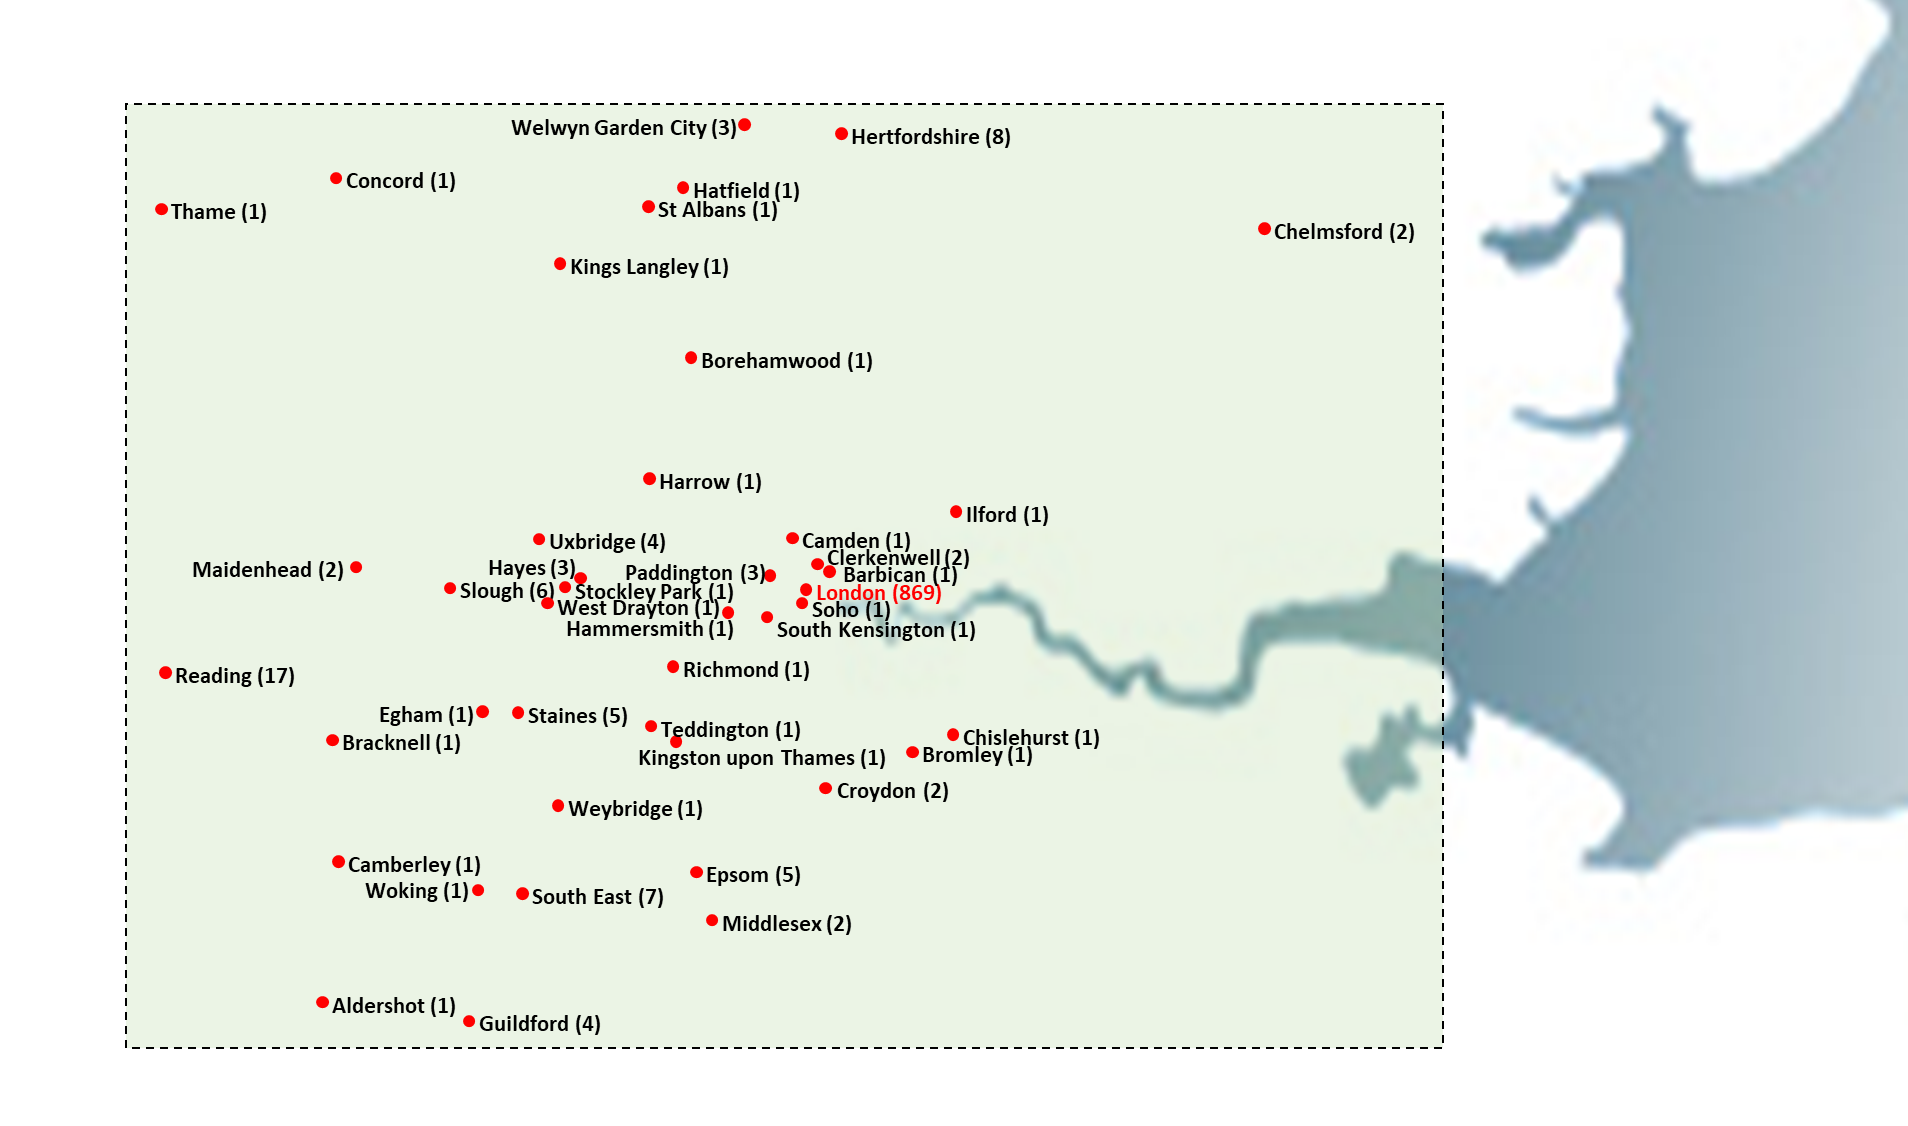
Figure 8B: Jobs in London and Home Counties
As mentioned previously, the stages presented form an iterative and cyclical process. As I progressed through each phase of the process my understanding of the opportunities and constraints developed, necessitating a return to an earlier step to refine or clarify the scope of the objectives, to revise options, adjust the approach and develop programs to aid data processing and analysis. You will frequently be told data extraction and cleansing can be the most time-consuming phase of such projects - the work presented here has taken 3 months.
These collective steps to access, extract, manipulate, clean, filter, transform, analyse and present data is commonly referred to as Data Wrangling or Data Munging – a critical skill for a Data Scientist.
References
For further reading on trends and skill requirements in the Data Science job market and distinctions of the different roles I have listed some articles you may find of interest:
- Quantifying the current demand for data scientists,
- Global AI trends: UK leads US for jobs,
- Why Data Science Is Such A Hot Career Right Now,
- Kaggle Data Scientist Survey 2017,
- 7 types of job profiles that make you a Data Scientist,
- What Can You Do with a Career in Data Science?,
- The Most Popular Language For Machine Learning and Data Science Is …,
- The Difference between Data Scientists, Data Engineers, Statisticians, and Software Engineers,
- Difference Between Data Scientists, Data Engineers, and Software Engineers - According To LinkedIn,
- How to Get Data Science and Machine Learning/AI Jobs | How to Become a Data Scientist,
- Data engineers vs. data scientists,
- Difference of Data Science, Machine Learning and Data Mining